
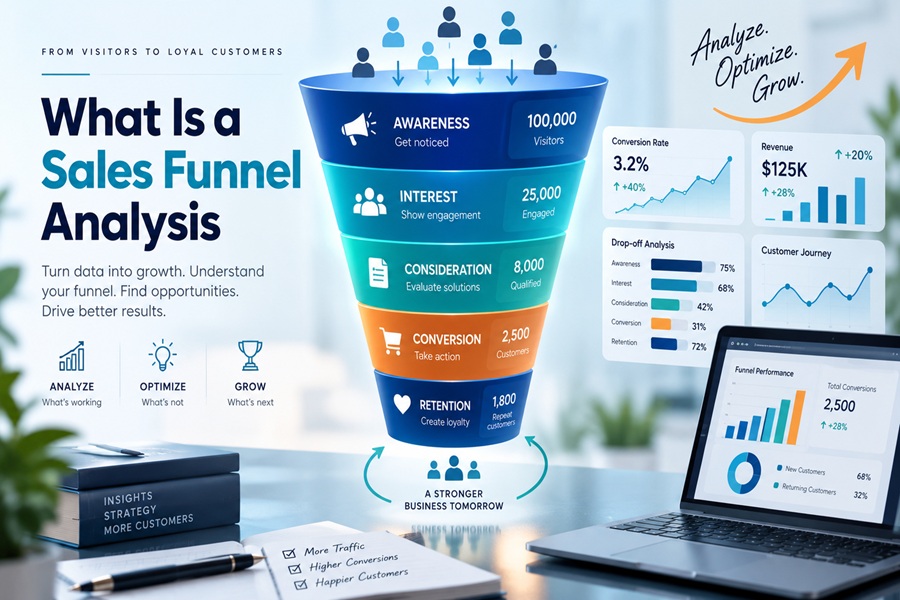
A sales funnel analysis is the process of measuring how many potential customers move from one stage of your buying process to the next, and where they drop off. It turns a vague feeling that “sales are slow” into a precise diagnosis, such as “plenty of people book demos, but very few of them ask for a proposal.”
Think of the funnel as a series of doors. Every business has them, whether it sells software, sofas or consulting hours. Analysis simply counts how many people walk through each door and asks why the rest turned back.
The stages most funnels share
Names vary by company, but most funnels follow a similar path.
- Awareness. Someone discovers you through search, social media, an ad, a referral or an event.
- Interest. They engage by visiting your site, reading content or signing up for something.
- Lead. They share contact details or ask a question.
- Qualified opportunity. Your team confirms they have a real need, budget and authority.
- Proposal or cart. A quote is sent, or an online shopper adds items to a cart.
- Purchase. The deal closes or the order is placed.
- Retention and expansion. The customer renews, reorders or upgrades.
An ecommerce funnel compresses these steps into minutes. A B2B funnel may stretch them across months and involve several people from the buying company.
A worked example
Here is a simplified quarter for a small B2B software company. The numbers are illustrative, but the method is exactly what a real analysis looks like.
| Stage | Count | Conversion to next stage |
|---|---|---|
| Website visitors | 20,000 | 2.5% become leads |
| Leads | 500 | 30% become qualified |
| Qualified opportunities | 150 | 60% get a demo |
| Demos held | 90 | 22% receive a proposal |
| Proposals sent | 20 | 45% close |
| Closed deals | 9 |
Look at each conversion rate rather than the totals. Most of these rates look healthy. Demo to proposal does not. Only about one in five demos leads anywhere, while proposals close at a strong rate. That tells the team their problem is not traffic, lead volume or closing skill. Something in the demo is failing to connect.
Fixing that one stage has an outsized effect. If demo to proposal rose to 35 percent, the same quarter would produce roughly 31 proposals and about 14 deals instead of 9, with no extra marketing spend.
How to run the analysis yourself
Define each stage clearly. A stage should be marked by something the buyer does, such as booking a call or requesting pricing, not by how hopeful the rep feels. Loose definitions make every number unreliable.
Pull the counts for a set period. A quarter works for most B2B teams. Ecommerce stores can work weekly or monthly because volume is higher.
Calculate stage to stage conversion. Divide the number at each stage by the number at the stage before it.
Measure time in each stage. Velocity matters as much as volume. A stage where deals sit for weeks often hides indecision, missing stakeholders or unclear next steps.
Segment the data. Break the funnel down by lead source, industry, deal size, region and rep. An average often hides one segment that converts beautifully and another that barely converts at all.
Ask why. Numbers locate the leak. Conversations explain it. Listen to recorded demos, read lost deal notes, survey shoppers who abandoned carts, and talk to customers who chose a competitor.
Common leaks and their usual causes
At the top, low lead conversion often points to weak calls to action, slow pages or traffic from the wrong audience. In the middle, poor qualification rates suggest marketing and sales disagree on what a good lead looks like. Late stage drop off usually comes from pricing surprises, missing decision makers, or proposals that list features instead of outcomes.
For online stores, the cart is the most famous leak. Baymard Institute’s long running research puts average cart abandonment at around 70 percent. Unexpected shipping costs, forced account creation and complicated checkout forms are among the most common reasons shoppers leave.
Why the classic funnel shape is changing
The tidy funnel assumes buyers move in a straight line. Many do not anymore. Gartner’s recent buyer survey found that 67 percent of B2B buyers say they prefer a rep free experience, and 45 percent used AI during a recent purchase. Buyers research, compare and shortlist vendors before ever filling in a form, then jump straight to a pricing conversation.
That changes the analysis in two ways. First, some of the most important funnel activity is invisible, happening in AI assistants, review sites and peer communities. Second, stages can be skipped or revisited. A good modern analysis tracks where buyers enter the funnel, not just how they move through it, and pays attention to self serve signals such as pricing page visits and product trial usage.
Tools that make it easier
Small teams can run a solid funnel analysis in a spreadsheet exported from their CRM. Larger teams use built in CRM reporting from platforms like Salesforce or HubSpot, product analytics tools for trial and app behavior, and web analytics for the top of the funnel. Conversation intelligence tools add the “why” by showing what was said in calls that converted versus calls that stalled.
The tool matters less than consistency. Use the same stage definitions every period so you can compare quarter to quarter.
Turning findings into action
Pick the single weakest stage and fix it before touching anything else. Write down the change, such as a new demo structure, a pricing page update or a shorter checkout. Then rerun the analysis after enough time has passed for deals to move through.
A funnel analysis is never finished. Markets change, buyers change, and a fix at one stage often reveals the next bottleneck. Teams that review their funnel regularly tend to find small, cheap improvements long before a slow quarter forces a painful one.